Screenshot: blogs.msdn.com/astrauss/
Alexander Strauss hat auf seinem Blog einen Artikel über ein Visualisierungswerkzeug auf Basis von Silverlight veröffentlicht. Die Visualisierungsform ist nicht wirklich aufregend, da es eine herkömmliche und etwas wuselige Darstellungsform für Informationsnetze ist. Interessant ist aber das dieses Visualisierungstool zusammen mit Visio verwendet werden kann und dass man den Quellcode für das Tool bekommen kann.
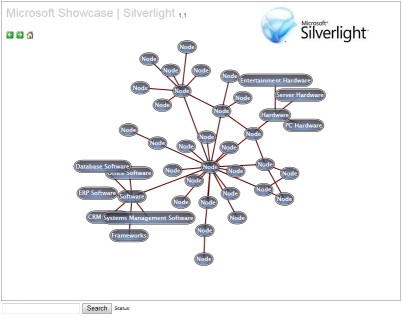
Recently we had an engagement at a cutomer with a department responsible for knowledge management. They were looking for a way to visualize some of their knowledge data in a intuitive way and make content related to that data acessible to all relevant people in that company. The underlying data model of the knowledge system was quite straight forward as there are nodes which represent knowledge keywords such as “Basel II” and connectros which represent relations between such keywords so that a related node would count as an edge of the previous node such as “Policies”. Until now one might think that this would end up in a simple tree however there are some extensions to the model as such that a keyword may not have any relations and therefore would stand alone. So a simple graph for such data could look like seen on the following picture.
Siehe auch:
Physics, Silverlight and Visualization…How Businesses Can Benefit!